How to Calculate Meta Ads ROAS in BigQuery
Calculate Meta Ads ROAS in BigQuery with SQL you can reuse — the core query, ROAS by campaign and over time, and the gotchas that make BigQuery and Ads Manager disagree.
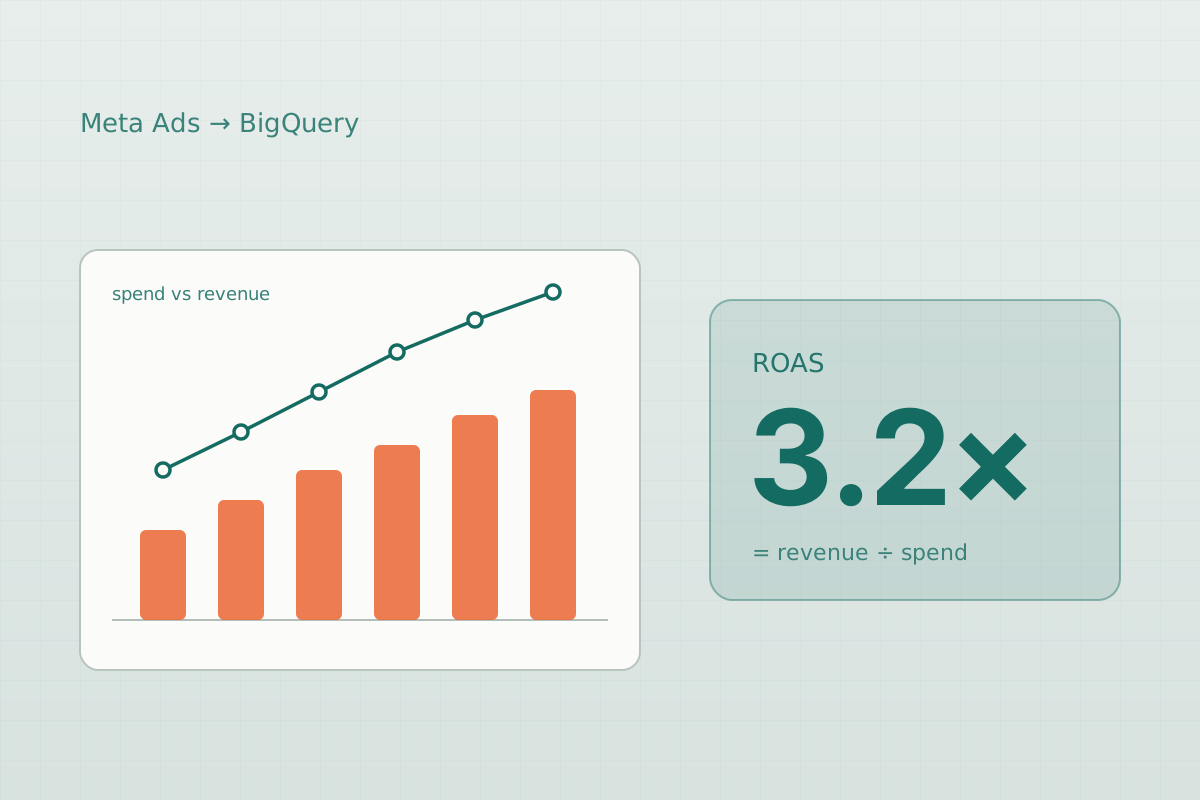
Return on ad spend (ROAS) is the first number anyone asks for about a paid campaign, and the last one you want to get wrong. Meta’s Ads Manager reports it for you, but the moment you need ROAS your way — blended with real order revenue, on your fiscal calendar, deduplicated, or joined to data Meta never sees — you compute it yourself. In BigQuery, that is a few lines of SQL you can save and reuse.
This guide covers the core query, ROAS broken down by campaign and over time, and the handful of details that quietly make a BigQuery number disagree with the one in Ads Manager.
ROAS in one line:
ROAS = revenue attributed to ads ÷ ad spend. A ROAS of4.0×means four dollars of revenue for every dollar spent. It is a ratio, so it has no currency and no percentage sign.
Before you start
This assumes your Meta Ads spend and conversion data already land in a BigQuery table — for example an AdInsights table populated by a replication tool. If a run “completed” but the table looks empty or stale, fix that first: Skyvia Facebook Ads replication completed but the BigQuery table is empty walks through it. If the SQL below is new to you, the 8 SQL queries I use in almost every analysis covers the SUM, GROUP BY, and date-filtering patterns it leans on.
Column names depend on how your pipeline named the Meta fields. The examples use Spend, ConversionValue, CampaignName, and DateStart (the Facebook Ads field naming Skyvia uses) — adjust them to match your own table. Replace your-project and your_dataset throughout.
The core ROAS query
Start at the account level: total spend, total revenue, and the ratio between them over the last 30 days.
SELECT
  ROUND(SUM(Spend), 2)                                     AS total_spend,
  ROUND(SUM(ConversionValue), 2)                           AS total_revenue,
  ROUND(SAFE_DIVIDE(SUM(ConversionValue), SUM(Spend)), 2)  AS roas
FROM `your-project.your_dataset.AdInsights`
WHERE DateStart >= DATE_SUB(CURRENT_DATE(), INTERVAL 30 DAY);
Three things are doing the work here:
SUMbefore you divide. ROAS is total revenue over total spend, not the average of per-row ratios. Summing first and dividing once is the only correct order.SAFE_DIVIDEinstead of/. If spend is ever zero, plain division throws a division by zero error and the whole query fails.SAFE_DIVIDEreturnsNULLinstead, so one empty day never breaks the report.ROUND(…, 2)keeps money at two decimals and ROAS readable.
For the example account, that returns total_spend = 25,000, total_revenue = 79,400, and roas = 3.18 — about 3.2×.
ROAS by campaign
The account number hides everything useful. The same pattern with GROUP BY tells you which campaigns earn and which leak:
SELECT
  CampaignName                                             AS campaign_name,
  ROUND(SUM(Spend), 2)                                     AS spend,
  ROUND(SUM(ConversionValue), 2)                           AS revenue,
  ROUND(SAFE_DIVIDE(SUM(ConversionValue), SUM(Spend)), 2)  AS roas
FROM `your-project.your_dataset.AdInsights`
WHERE DateStart >= DATE_SUB(CURRENT_DATE(), INTERVAL 30 DAY)
GROUP BY campaign_name
ORDER BY roas DESC;
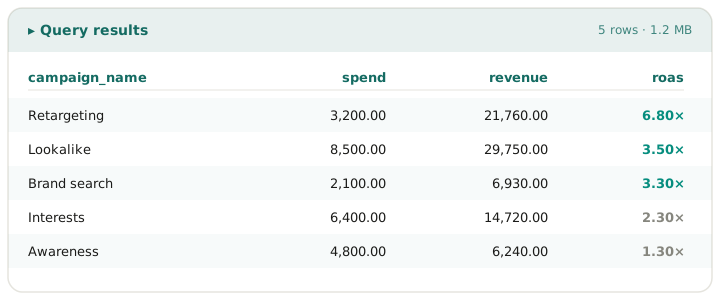
Sorted by ROAS descending, the best and worst campaigns fall to the top and bottom of the result grid:
The same numbers as a chart make the story obvious at a glance — where each campaign sits against a 3.0× target:
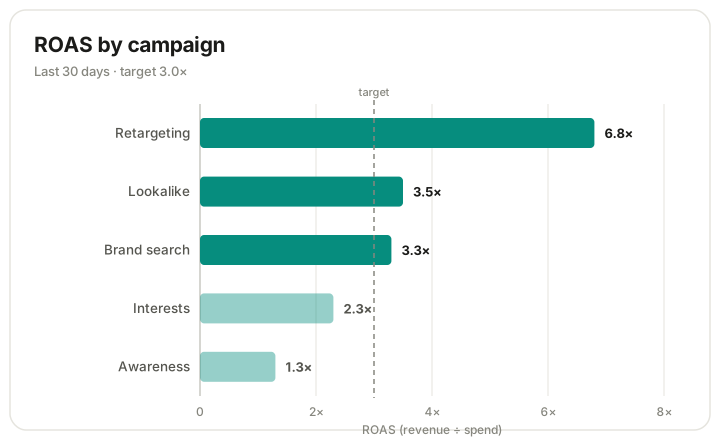
Two campaigns beat the target and two fall short. Awareness at 1.3× is the one to question first — it spends $4,800 to return $6,240, which barely clears break-even before any product or fulfilment cost.
ROAS over time
A single 30-day figure can’t tell you whether things are improving. Truncate the date to a month and the trend appears:
SELECT
  DATE_TRUNC(DateStart, MONTH)                             AS month,
  ROUND(SUM(Spend), 2)                                     AS spend,
  ROUND(SUM(ConversionValue), 2)                           AS revenue,
  ROUND(SAFE_DIVIDE(SUM(ConversionValue), SUM(Spend)), 2)  AS roas
FROM `your-project.your_dataset.AdInsights`
WHERE DateStart >= DATE_SUB(CURRENT_DATE(), INTERVAL 6 MONTH)
GROUP BY month
ORDER BY month;
Plot spend and revenue on the same axis — both are dollars, so they belong on one scale — and the gap between them is the ROAS story:
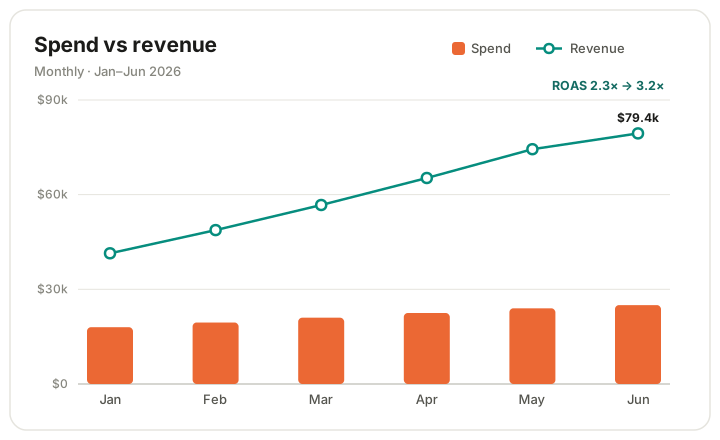
Revenue is growing faster than spend, so ROAS is trending up even as the budget grows. That is exactly the pattern you want to confirm before scaling: spending more and earning proportionally more, not just buying flat returns.
Five things that quietly make your ROAS wrong
The arithmetic is trivial. The correctness is not. These are the usual reasons a BigQuery ROAS is misleading — or disagrees with Ads Manager.
- Dividing by zero, or by nothing. A day, campaign, or filter with no spend makes
revenue / spendblow up or read as infinity.SAFE_DIVIDEreturnsNULLfor those cases so a single gap never poisons the report. Wrap every ROAS division in it. - What “revenue” actually means.
ConversionValueis whatever your pipeline mapped it to. Meta’s own value comes from the conversions it can attribute (for example website purchase value from the pixel) — not your bank’s version of revenue, and not net of refunds. If finance needs true, refunded, margin-aware revenue, join real order data instead of trusting the platform’s number. - Attribution windows. Meta credits a conversion to an ad using a click/view window (commonly 7-day click). Revenue that Ads Manager attributes to ad-click date can land on a different calendar day than the order itself. If your BigQuery date field is the insight date, your daily totals will legitimately differ from a report built on conversion date.
- Time zone. Meta reports in the ad account’s time zone; BigQuery
DATE/TIMESTAMPmath runs in UTC unless you say otherwise. ADATE_TRUNCon a UTC timestamp can shift spend across a day boundary and make month boundaries wobble. Truncate in the account’s zone (DATE(timestamp_col, "America/Toronto")) when the day has to line up. - Row grain and duplicates. ROAS is only correct if each spend and revenue value is counted once. Insights tables usually store one row per entity per day; if a backfill or overlapping sync doubled some rows,
SUM(Spend)inflates and ROAS collapses. Confirm the grain (SELECT DateStart, CampaignName, COUNT(*) … HAVING COUNT(*) > 1) before you trust a total.
How to read a ROAS number
ROAS is not “good” or “bad” in the abstract — it is good or bad relative to your margin. The break-even point is set by how much of each sale you keep:
Break-even ROAS = 1 ÷ gross margin. At a 40% margin you need
2.5×just to cover the cost of goods; at 25% you need4.0×. Below break-even, more spend loses more money.
| ROAS | Reading (against a typical 30–40% margin) |
|---|---|
< 1.0× | Revenue is below spend — losing money before any costs |
1.0–2.0× | Above spend but usually below break-even once margin is applied |
2.5–4.0× | Around break-even to healthy for most stores and lead-gen |
4.0–6.0× | Strong; a candidate to scale budget carefully |
> 6.0× | Excellent, or under-spending — test more budget before assuming it holds |
FAQ
What is a good Meta Ads ROAS?
The only honest answer is “above your break-even,” which is 1 ÷ gross margin. A 4.0× ROAS is a loss at a 20% margin and a healthy profit at 50%. Compute your break-even once, then judge every campaign against it rather than against a rule of thumb.
Why does my BigQuery ROAS differ from Ads Manager? Almost always one of four things: a different attribution window, a time-zone mismatch (Ads Manager in account time, BigQuery in UTC), a different definition of revenue (platform-reported vs. your real orders), or in-progress conversions that Meta is still attributing. Small gaps are expected; large ones point to grain or duplication issues.
Where does the revenue value come from? From whatever column your pipeline populated. Most commonly it is Meta’s attributed purchase value (from the pixel or Conversions API). If you need revenue net of refunds, taxes, or shipping — the version finance recognizes — you have to join your own store or CRM data and compute ROAS against that instead.
How do I avoid a divide-by-zero error?
Use SAFE_DIVIDE(revenue, spend), which returns NULL when spend is zero, or revenue / NULLIF(spend, 0). Never use a bare / in a ROAS expression that runs over grouped or filtered data.
Should I use Meta’s revenue or my own? Meta’s is immediate and needs no joins, which is fine for in-platform optimization. Your own order revenue is the truth for the business but requires matching orders back to campaigns. Many teams report both side by side and treat a widening gap between them as a data-quality alarm.
Key takeaways
- ROAS is
SUM(revenue) ÷ SUM(spend)— sum first, divide once, and always wrap the division inSAFE_DIVIDE. - The account-level number hides the story;
GROUP BYcampaign and by month is where the decisions live. - Put spend and revenue on one shared dollar axis — the gap between them is ROAS.
- A BigQuery ROAS legitimately differs from Ads Manager because of attribution window, time zone, revenue definition, and in-progress conversions — reconcile those before assuming the data is wrong.
- Judge ROAS against break-even = 1 ÷ margin, not a universal target.
Related
- Skyvia Facebook Ads replication completed but the BigQuery table is empty — make sure the table you are querying actually has rows.
- The 8 SQL queries I use in almost every analysis — the grouping and filtering patterns behind these queries.